Spend
What did we spend?
Loading snapshot…
Drivers
Where does the money go?
Trend
How does this period compare?
Top risers
Top fallers
Opportunities
Where can we recover spend?
Action queue
Who does what next?
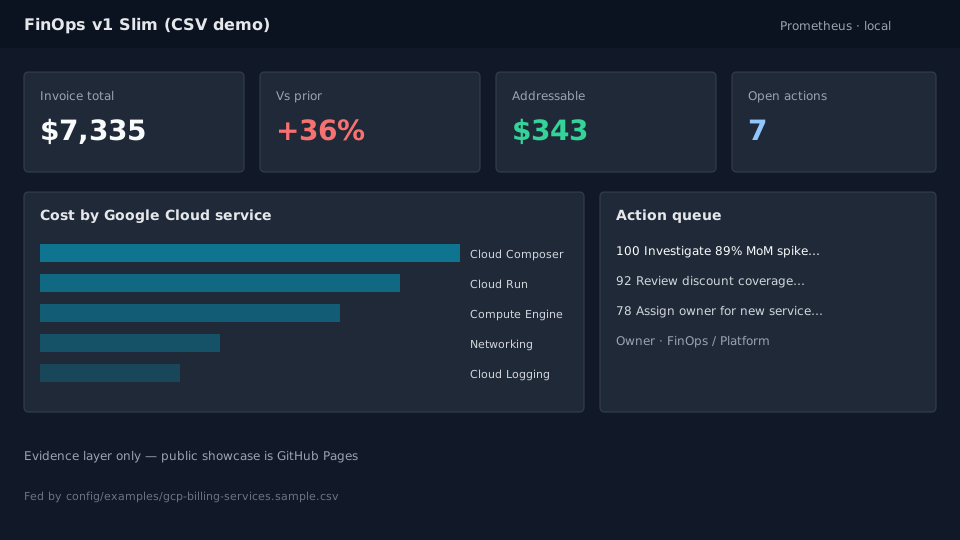
Priority score is 0–100 (higher = do first): estimated monthly savings weighted by urgency signals such as MoM growth spikes, new-service risk, and discount gaps. Queue is sorted highest score first.
Alerts
What needs attention now?
Under the hood
Built like a delivery, not a slide deck.
The demo is driven by a Google Cloud billing CSV: normalized into metrics, opportunity heuristics, and the ranked action queue above. The same snapshot can power a local Prometheus + Grafana stack when you want the ops console view.